WAREHOUSE TEMPERATURE MAPPING Services
Temperature Mapping Services, in Compliance with GxP and WHO
To date, METCAL had completed well over 150 warehouse temperature mapping services with no deviation. Whether a warehouse is being used for storage of food, medical supplies, or any other perishable goods, they are held to the same standard guidelines.
As an integral part of these guidelines, warehouse temperature mapping services or temperature validation studies must be performed to ensure that the entire space is maintaining safe temperature and humidity levels, depending on the product being stored. Inadequate storage environment can not only result in spoiled food but can also result in unsafe medicines or other health hazardous results.
Data loggers play a crucial role in this mapping process. They provide a complete overview of the storage environment that can easily be analyzed to determine if the warehouse is maintaining safe conditions for the stored product.
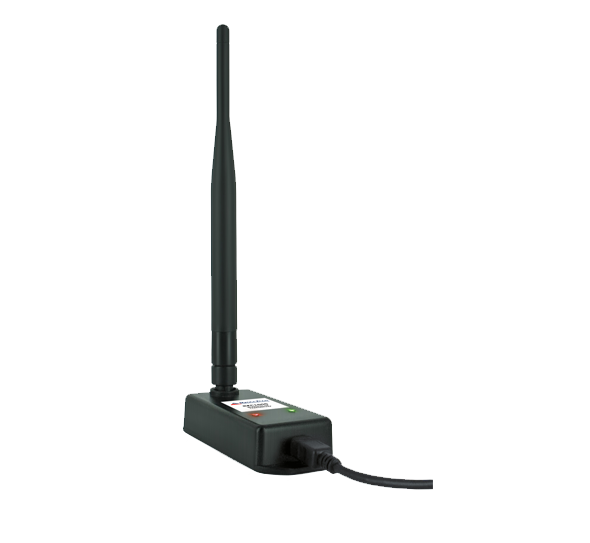
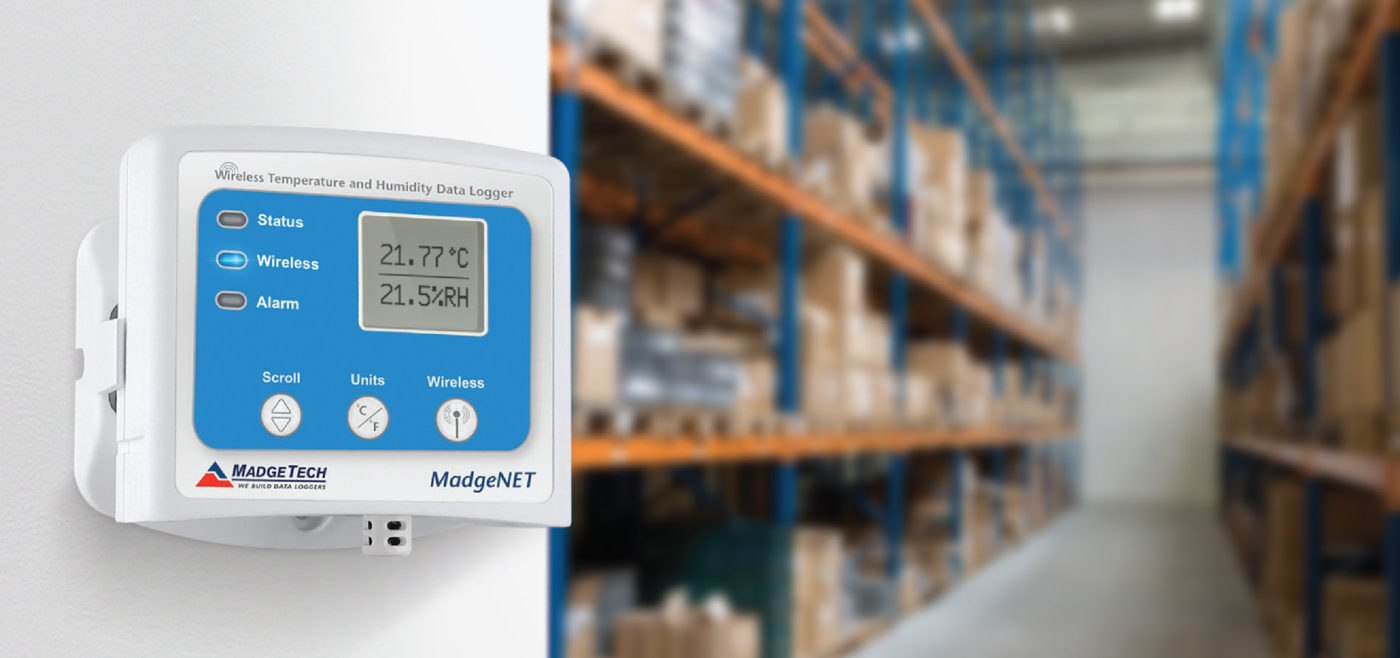
MadgeTech wireless, real time data loggers are particularly beneficial for monitoring warehouse temperature and humidity with environmentally sensitive products. They measure, record and wirelessly transmit data back to a computer for real-time monitoring, or to MadgeTech Cloud for instant remote access from any computer or mobile device. Additionally, notifications can be configured to send an email, sms, text, voice call or screen message to designated contacts if the data received is out of a user programmable safe range or deviation.
Good Warehouse Practices for Warehouse Temperature Mapping
Step 1: Create a Temperature Mapping Plan
The temperature mapping plan is the master reference document specifying the action that the company will take to qualify all aspects of the facility, equipment and staff to ensure compliance standards are upheld. Keep in mind this mapping plan will be the first thing regulators will see to evaluate the company’s methods, so rationale on methods should be thoroughly explored.
Step 2: Determine What Areas Will be Monitored and Identify Areas of Risk
If a warehouse is large, there is a greater risk of temperature fluctuation throughout the space. Smaller warehouse tends to heat up more quickly, which poses just as much risk to the product inside. Every warehouse is different, so it is necessary to have a basic understanding of the particular environment prior to beginning the mapping process and identify areas that are at risk of unacceptable variations.
Step 3: Create a Detailed Protocol
Using the information collected during the risk assessment, be sure that the protocol includes all the necessary details pertaining to the temperature mapping study and an explanation of how those decisions were made.
Step 4: Select the Appropriate Wireless, Real Time Data Loggers
METCAL highly knowledgeable staffs are available to answer questions and guide customers through the process of choosing the right tools for the job. Our technical support teams are experienced with the variables of temperature mapping studies and are even available for on-site assessments or implementation if needed.
Step 5: Set Up the Wireless, Real Time Data Loggers Throughout the Warehouse
The data loggers should be set up according to what is established in the temperature mapping protocol. As a basis, the warehouse can be divided into several sections and layers, with logger placed in each one. It is important to consider the product itself. If the product is being stored on shelves or racks, the data loggers should be placed in the middle of the racks throughout each layer to provide a representation of what the product is experiencing.
Step 6: Conduct Warehouse Temperature Mapping and Review the Results
MadgeTech wireless data loggers can transmit and record data in real time, providing the user with an instantaneous view of the environment as it is happening. Analyzing data by using Mean Kinetic Temperature (MKT) to evaluate readings from a single data logger if the temperature profile fluctuates in a distinct pattern, such as a sinusoidal wave with repeating temperature peaks and dips. MKT will give an accurate mean temperature for a data logger that experiences short excursions.
Step 7: Make Modifications as Necessary
After the data has been sufficiently analyzed and documented, certain aspects of the warehouse need to be changed or improved.
Did You Know MKT?
The Mean Kinetic Temperature is defined as: TK is the mean kinetic temperature in kelvins; ΔH is the activation energy in kJ; R is the universal gas constant; n is the number of sample events. When the samples are taken after the same time period, and Tn is the temperature taken at a sample point n in kelvins. This equation weighs each data point against all of the other data points taken in a study, so small excursions from the normal operation of the storage area, such as product loading or movement, and door openings, will not have a great effect on the calculation of the mean temperature of a specific location of the storage space.